Daily snapshot · whale watch ·
INDICIA Radar
A single daily report that stitches three streams: the market's data, what smart money is doing in futures (Hyperliquid) and options (Deribit), and a deep analysis: Anthropic's Fable 5 AI model hunts for patterns and smart-money traces in our own data archive. Not signals — a decision journal: where risk is denser and whether smart money agrees with itself, not where price will go. The full report — free.
— A decision journal, not signals. We show forecasts that held and forecasts that did not.
INDICIA DESK · report for 16.10 · updated 05:32 UTC · daily · ~11 min read
Market data
Deribit implied-volatility index. Lower — cheaper options, calmer market.
Aggregate top-wallet positions read on-chain from Hyperliquid (not a model). The gap between the lines is whale conviction.
📦 WHERE OPEN INTEREST SITS · DERIBIT OPTIONS
OI is how many contracts are currently open. The clusters show on which expiries and strikes the market has already taken positions.
BTC 403 k contr. · by expiry: 30.10 — 37% (core $95 000) · 25.12 — 32% (core $80 000) · 26.03 — 10% (core $60 000)
BTC top strikes: $95 000 30 k (99% calls) · $90 000 28 k (97% calls) · $80 000 24 k (55% calls) · $100 000 24 k (99% calls)
ETH 1545 k contr. · by expiry: 25.12 — 39% (core $3 200) · 30.10 — 18% (core $2 600) · 26.03 — 14% (core $2 400)
ETH top strikes: $3 200 100 k (99% calls) · $2 300 92 k (55% puts) · $2 200 91 k (63% calls) · $2 500 84 k (67% calls)
🕐 as of 05:32 UTC
Report for
Case No. 20261016 · 16.10.2026 04:33 UTC · BTC $81,969 / ETH $2,439 · analysis: Fable 5.1 by Anthropic
📅YESTERDAY
⚡THE GIST
🐋WHALES: WHAT CHANGED — three arenas
Arena one — Hyperliquid futures. We measure the day's change in coins between the 04:16 UTC snapshots — on the constant set and on all addresses of both snapshots (how we track whale positions).
In BTC on the constant set — 128 addresses — the longs shrank by 705 BTC and the shorts added 73 BTC: the short tilt grew by about $64M; between the 03:46 snapshots — by $78M. Across all addresses — +1,083 BTC of longs and +743 BTC of shorts: about $28M toward long, $34M at 03:46. The difference is the addresses that weren't in yesterday's snapshot — mostly one.
In ETH on the constant set the longs added 4,946 ETH and the shorts 17,525 ETH: about $30–31M toward short. Across all addresses — about $9M toward long.
Across the registry — among positions with a liquidation price — the totals at the 04:16 UTC snapshot: BTC long $283.5M against a short of $748.1M, ETH $359.1M against $707.5M. The whales' long share in BTC is 27.5% against 22.1% yesterday: the short is 2.6 times the long, where yesterday it was 3.5 times. The short side grew too — by $69M.
Overleveraged whales number 64 against 66 yesterday, $1.08B of positions together against $996M; the longs among them are 64% against 67%. By our fragility index none is near a margin call, against one yesterday.
Arena two — Deribit options. Over two days 65 structures were recognised in bitcoin against 56 yesterday, and 21 in ether against 13. Today is the Friday expiry: almost 18 thousand contracts in bitcoin and more than 122 thousand in ether.
The largest fresh ones in bitcoin: a position that pays on a sharp move away from a level far below the market, and positions on a moderate rise — among them one that pays if price settles near a certain level above the market. In ether — a position on a rise up to a certain level, insurance sold on a calm, and a position on a rise financed by selling protection against a fall.
Quiet accumulation outside the blocks over the week (what a block is): in bitcoin calls above the market top the list again, with puts below them; in ether — calls above the market, while puts on the Friday expiry are being unwound.
Arena three — money at the exchange border. The snapshot is fresh — up to this morning.
Over seven days $79.8M was brought into the exchange and $59.8M taken out: this time $20.0M more arrived than left, where yesterday $13.3M more had left. USDC cash made the turn: $22.1M in against $7.9M out. Bitcoin: $40.0M out against $29.8M in; ether is nearly level — $5.3M in, $3.7M out.
This is positioning, not a direction forecast.
🧭CROSS-CHECK — five camps of witnesses
What the funds are doing. Spot ETFs are the only camp that measures purchases of the coin itself, not a leveraged position.
There are no fresh figures: the SoSoValue data source hasn't answered since last Friday. The latest are for Thursday 08.10.
This camp is silent: no data.
What the options market says. This camp measures one thing: what insurance costs on the Deribit book.
BTC skew is +1.6 against +2.5 yesterday — puts still dearer than calls, but the tilt eased (what skew is). In ETH +1.4 against +1.5.
BTC two-day vol sits in the 7th percentile since February against the 61st yesterday; DVOL 37.5 against 38.6 (what implied vol is). The two-day window now reaches past the Friday expiry.
Our fear-and-greed index stands at 54 out of 100 against 58 yesterday.
This camp is silent: insurance got cheaper — one of the cheapest levels since February.
What the futures say. This camp measures who pays whom to hold a position.
BTC funding on Hyperliquid is +0.010% in eight-hour terms, as yesterday; on Binance +0.006% against −0.001% (what funding is). In ETH +0.010% and +0.008% against +0.005% and −0.002% yesterday.
This camp is silent: funding sits near zero, with longs paying slightly more.
What the crowd is doing. This camp measures how retail accounts stand against the whales.
On Bybit perps 61.7% of BTC accounts stand long against 63.5% yesterday, and in ETH 72.3% against 72.4%.
This camp is silent: the crowd trimmed its longs a little after yesterday's buying.
Any signs of stress. This camp measures whether anyone has already been forced out of the market.
On OKX swaps $1.2M was liquidated over the day, 61% of it shorts, against $3.7M of longs yesterday; that is 20% of the week's liquidations.
This camp is silent: shorts got forced out on the bounce, but not many.
Again: this is positioning, not a direction forecast.
🌡ALTSEASON — the classic and our barometer
⚖️VERDICT OF THE DAY
🔒In today's full RADAR:
📊POLYGON
⚙️Pendulum · Wheel (the best of four versions, live curve on real prices)
signal                    trades   win    last     total  since
Dust Strategy V2              49    4% −$1,125  +$79,469  21.03
Dust Strategy V1              40    8% −$1,125  +$26,934  20.03
Volatility Convergence V3     38   37%   −$543  +$11,376  26.05
Skew 2.0 V2                   49   33%   −$663   +$6,464  26.05
Fear Flash V3                 11   27%   −$139   +$1,766  23.05
Deepest in the red: Wheel Trail V8 −$10,812 · Wheel Trail V6 −$9,823 · Wheel Trail V7 −$8,763 — three versions of one signal that hunts a reversal and pays for every attempt while the trend runs. One trade closed in the top five over the day: Skew 2.0 V2 −$663. The most profitable signal wins only 4% of its 49 trades. Win rate isn't money.
📅PUBLIC LEDGER
📏Scale calibrator
Not investment advice and not a recommendation to trade. Derivatives trading carries a high risk of loss; INDICIA DESK is a research publisher, not an adviser licensed by MAS, the SEC or the FCA — decisions and their consequences are yours.
Volatility in one frame
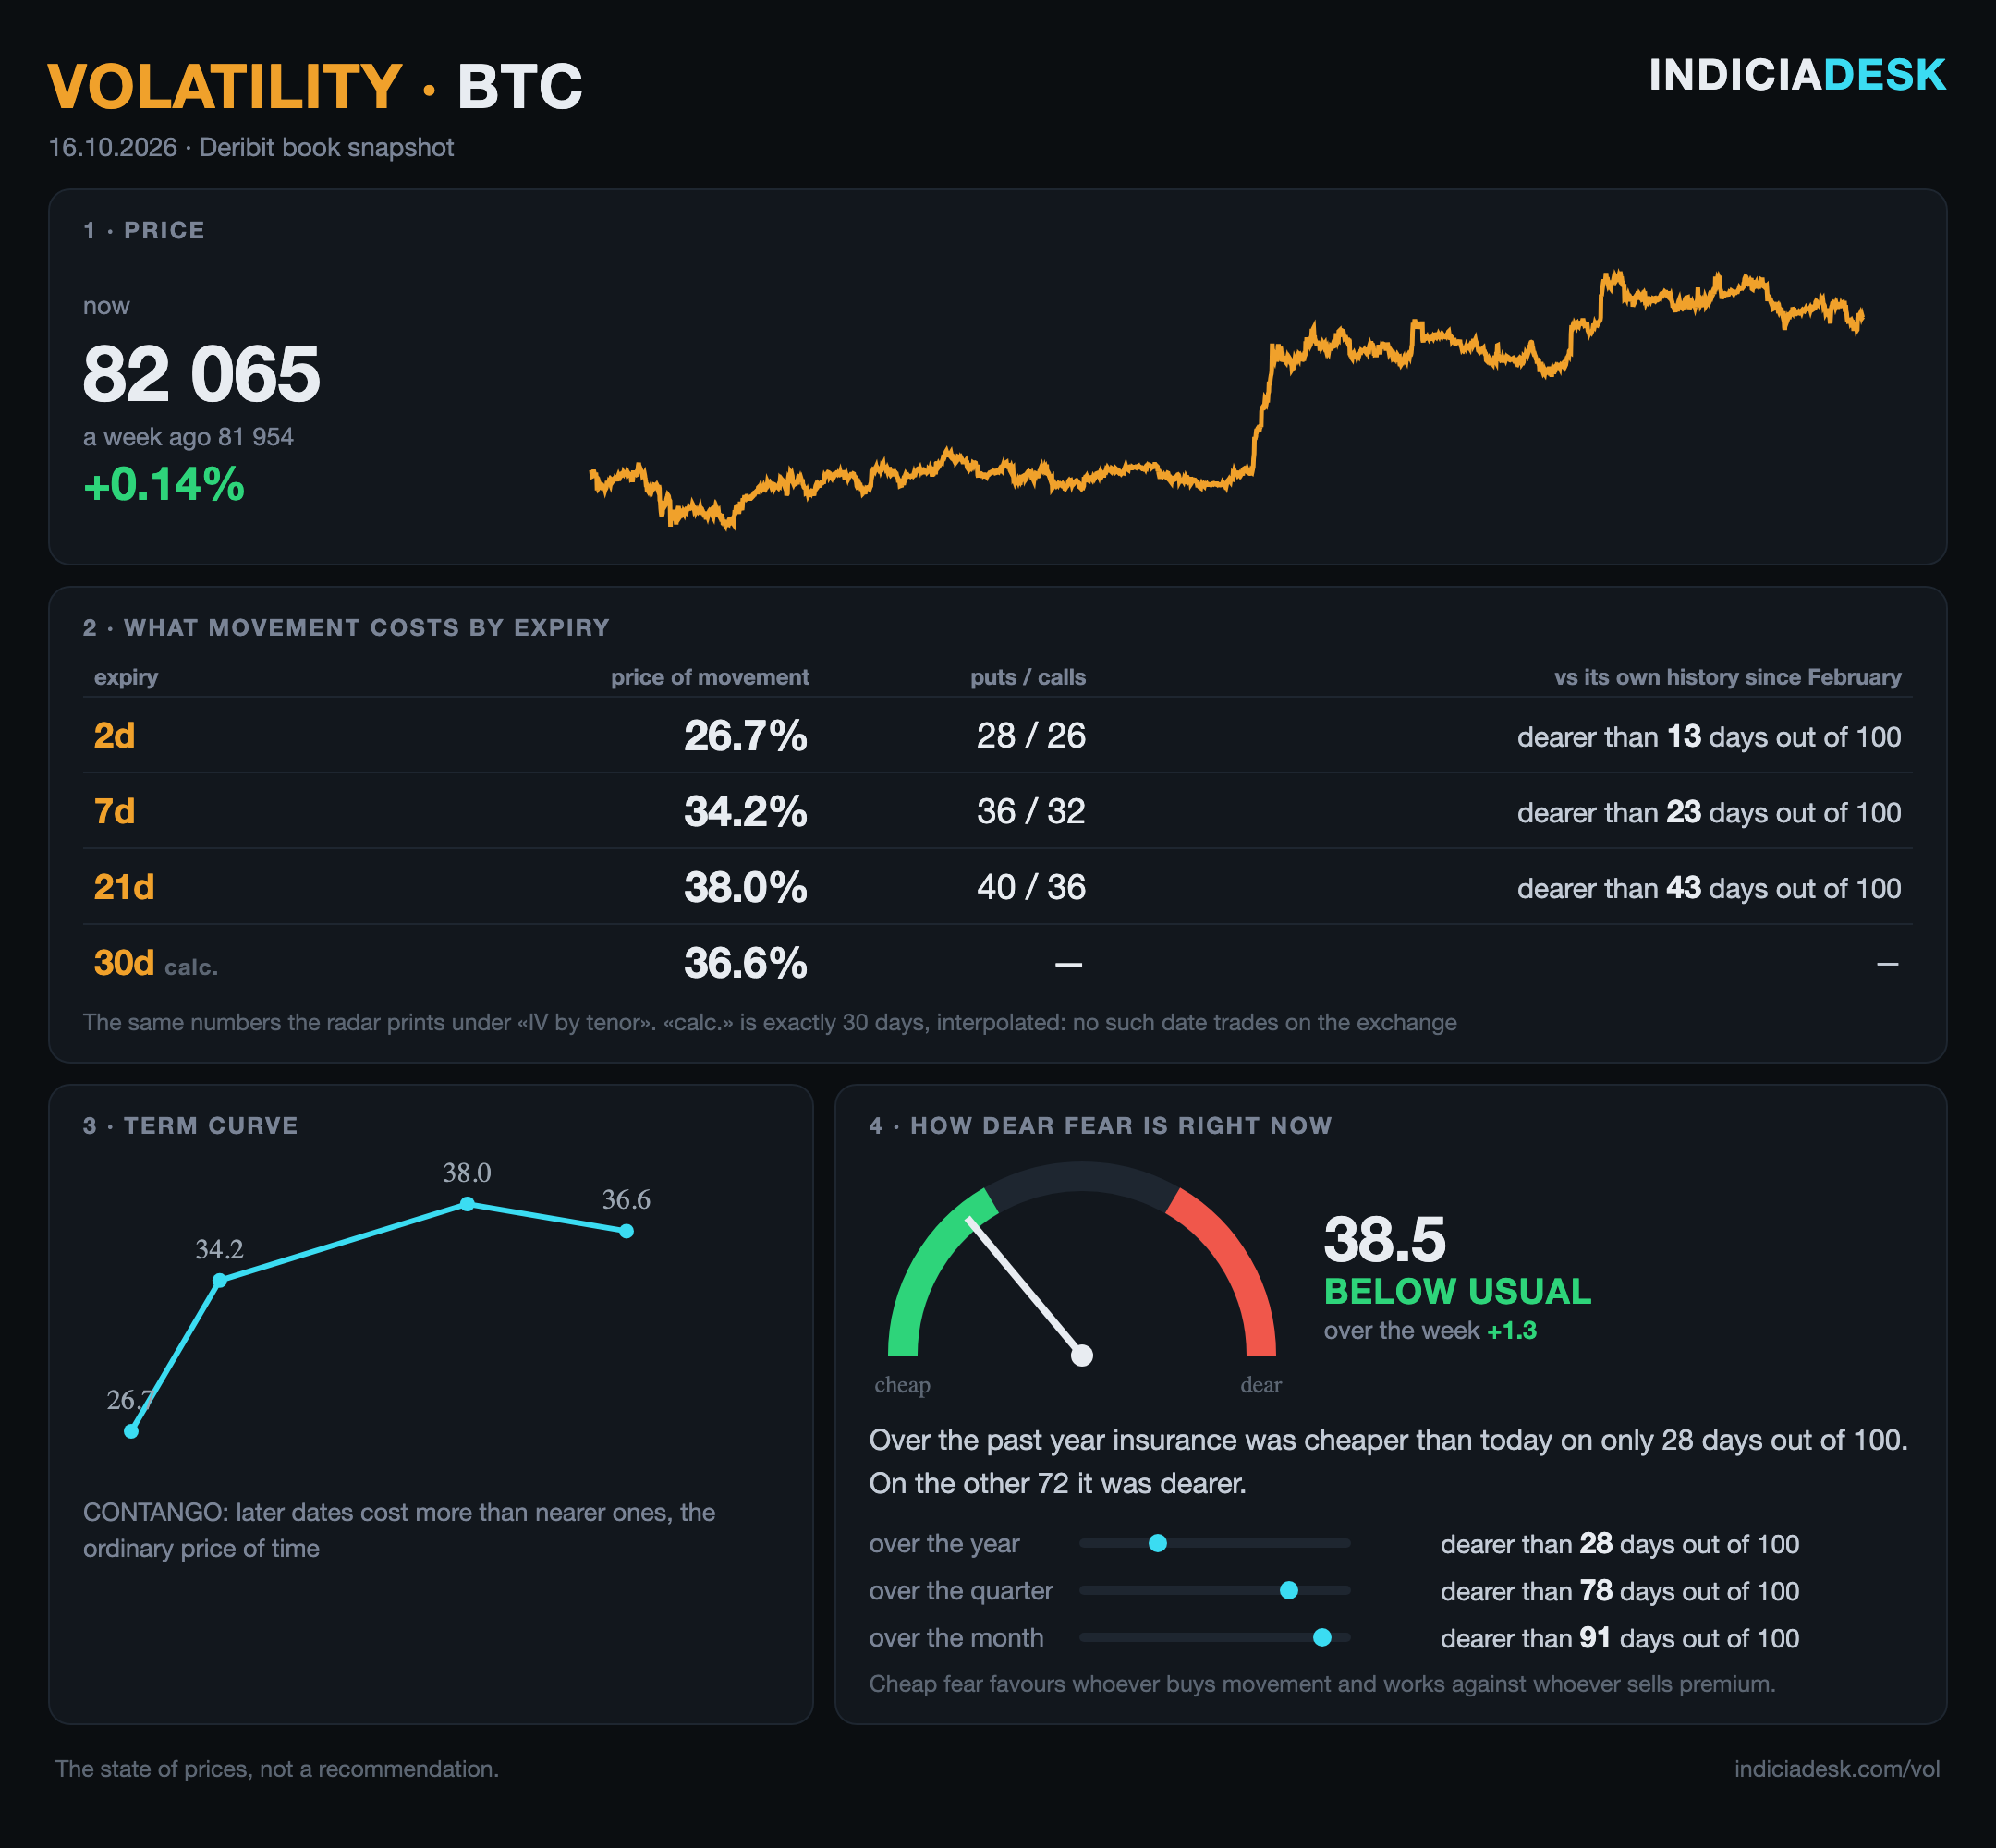
What movement costs by expiry, and how dear fear is against its own history. The full version, with whale legs on the strike axis and what followed the same level of fear, sits in the paid block below.
The data beneath the report — by access
Exact position sizes, strikes, whale call-signs, the liquidation heatmap and live event tracking are opened by the subscription. The report itself stays free every day.
Pricing & access →📅 Report archive → · what the system said and what price did
Frequently asked questions
How does the Radar work?
Every morning the Radar pulls the overnight changes into a deep analysis built by Anthropic's Fable 5 AI model: what the whales did, whether market indicators confirm it, a verdict — and a check of yesterday's call. The data are live Deribit / Hyperliquid / OKX snapshots, each time-stamped.
How often is the Radar updated?
Daily: the report date and the update time sit at the top of the page. While today's report is being prepared, the previous one stays here with its own date, and the live dashboards (levels, whales, fear) update automatically.
What is free and what needs a subscription?
The report itself stays free every day. Exact position sizes, strikes, whale call-signs, the liquidation heatmap and live event tracking are opened by the subscription; details become free after 7 days.
Is this investment advice?
No. It is the system's decision journal, not signals and not investment advice: where risk is denser and whether smart money agrees with itself, not where price will go. A whale may be hedging a portfolio, not betting on direction, so blindly copying a single trade is a bad idea.
The Radar is assembled automatically from live Deribit / Hyperliquid / OKX data · time-stamped snapshots. The system's decision journal, not investment advice. © 2026 INDICIA DESK.